Custom Queries
Build Once, See It Everywhere
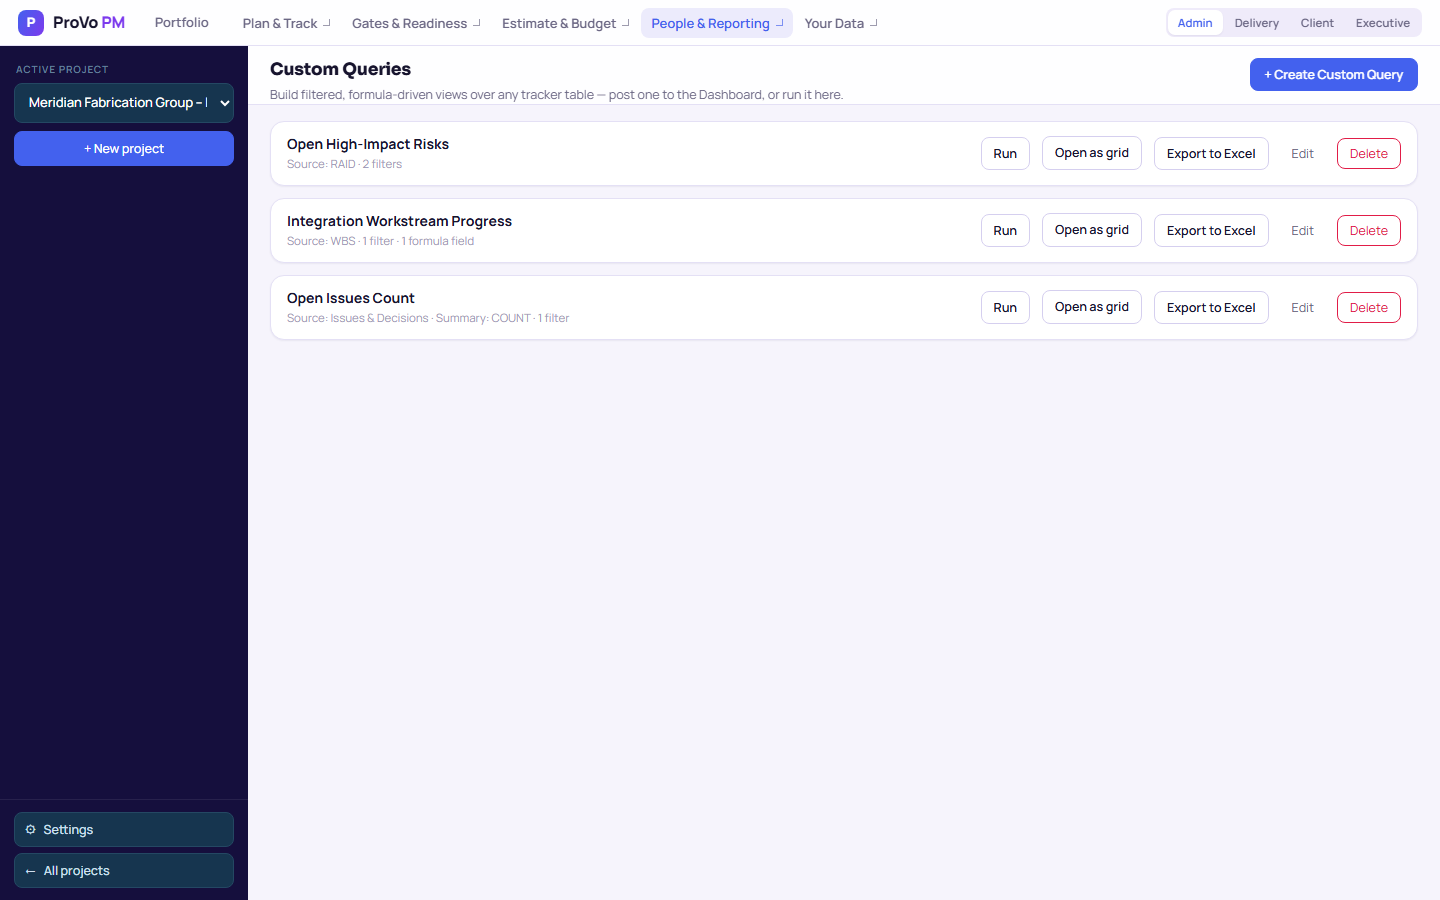
Every tracker is a table. A custom query is a saved, filtered, formula-driven view of one — or of another query's output — that you can chart on the dashboard, drill into, sort as a full-page grid, or export to Excel with the formulas still live.
How it works
Filter, Compute, Chain
A query starts from a source — any raw tracker, or another query's result — and layers filters and formula columns on top.
Filter Any Field
Equals, doesn't equal, greater or less than, contains, is empty, is not empty — against a raw field or a formula column you've defined in the same query.
Formula Columns
Arithmetic, comparisons, IF, ISBLANK, CONCAT, ROUND and more, referencing fields by name with [Field Name]. Compute a column the source table doesn't have.
Chain Queries
Build a query from another query's output — a second pass of filtering or aggregation on an already-shaped result. Cycles are caught before they'd loop.
Where the results go
A Query Is Not Just a List
On the Dashboard
Post a query to the dashboard as a portlet — a table, a bar chart, a line chart or a pie chart, your choice per query. An optional summary (count, sum, average, min or max) rolls the result into a single KPI number instead of a full table.
As a Full-Page Grid
Open any query as its own sortable grid, by any column including the computed ones — safe to sort freely, because a query's output is read-only and never the source data itself.
Drill Into the Source
Click a row in a query result to open the underlying tracker record directly, with its notes, in the same drawer used everywhere else in the product.
Export to Excel, Formulas Intact
A formula column translates to a real Excel formula on export, not a frozen value — open the file and the logic is still there, recalculating if you edit it.
Shared, not personal
A Query Is a Project Object
A saved query isn't a personal view sitting in your browser — it's stored on the project like any tracker, so everyone who opens it sees the same saved queries and the same dashboard portlets.
Turn a Filter Into a Chart in Minutes
No separate BI tool, no export-then-pivot. Build it against your own data and post it straight to the dashboard.