WBS & Phases
Four Columns You Type, and the Rest Is Arithmetic
Type your task list, import it as CSV, or add tasks and phases from the Board. Tag each task to a phase and a workstream in your own words, whether that is Financials and Order to Cash on an ERP rollout or Mechanical and Electrical on a building job. Four numbers drive the arithmetic, and everything downstream derives from them.
- Task: your own wording. Import it once from a CSV and it becomes the plan.
- Baseline Hrs: your estimate for a typical client. The Estimator can set these for a whole workstream at once.
- Scope Factor: your multiplier for this one. 1 is typical; 1.5 is half again as much work; 0.5 is a client who already has it.
- % Complete: the single completion signal. No parallel status field to drift out of sync.
- Actual Hrs: filled in from timesheets as people log time, so nobody retypes them.
- Priority, complexity, role, gate, and start and finish dates sit on the same row. Edit many rows at once, resize columns to fit, and keep dated notes on any task.
An example seven-phase ERP plan. Phases, workstreams and gates are whatever your WBS says; nothing is pre-loaded into a new project.
Discovery
Kickoff and charter, current-state review, gap analysis, requirements confirmation.
Design
Chart of accounts, process design by workstream, integration and migration mapping specs.
Build
Configuration, customisation, integrations, draft data loads.
Test
UAT scripts executed, defects triaged P1 to P3, rework and retest, dress rehearsal.
Training
Train the trainer, end-user sessions, runbooks and quick-reference guides.
Go-Live
Cutover, final loads, reconciliation, the go/no-go decision and switch-on.
Post Go-Live
Hypercare, defect burn-down, responsibility handover, closure.
Timeline
A Gantt You Did Not Have to Draw
The timeline lays itself out from the phase plan and the task hours. Workstreams inside a phase run in parallel, the way they actually do, rather than in one long queue.
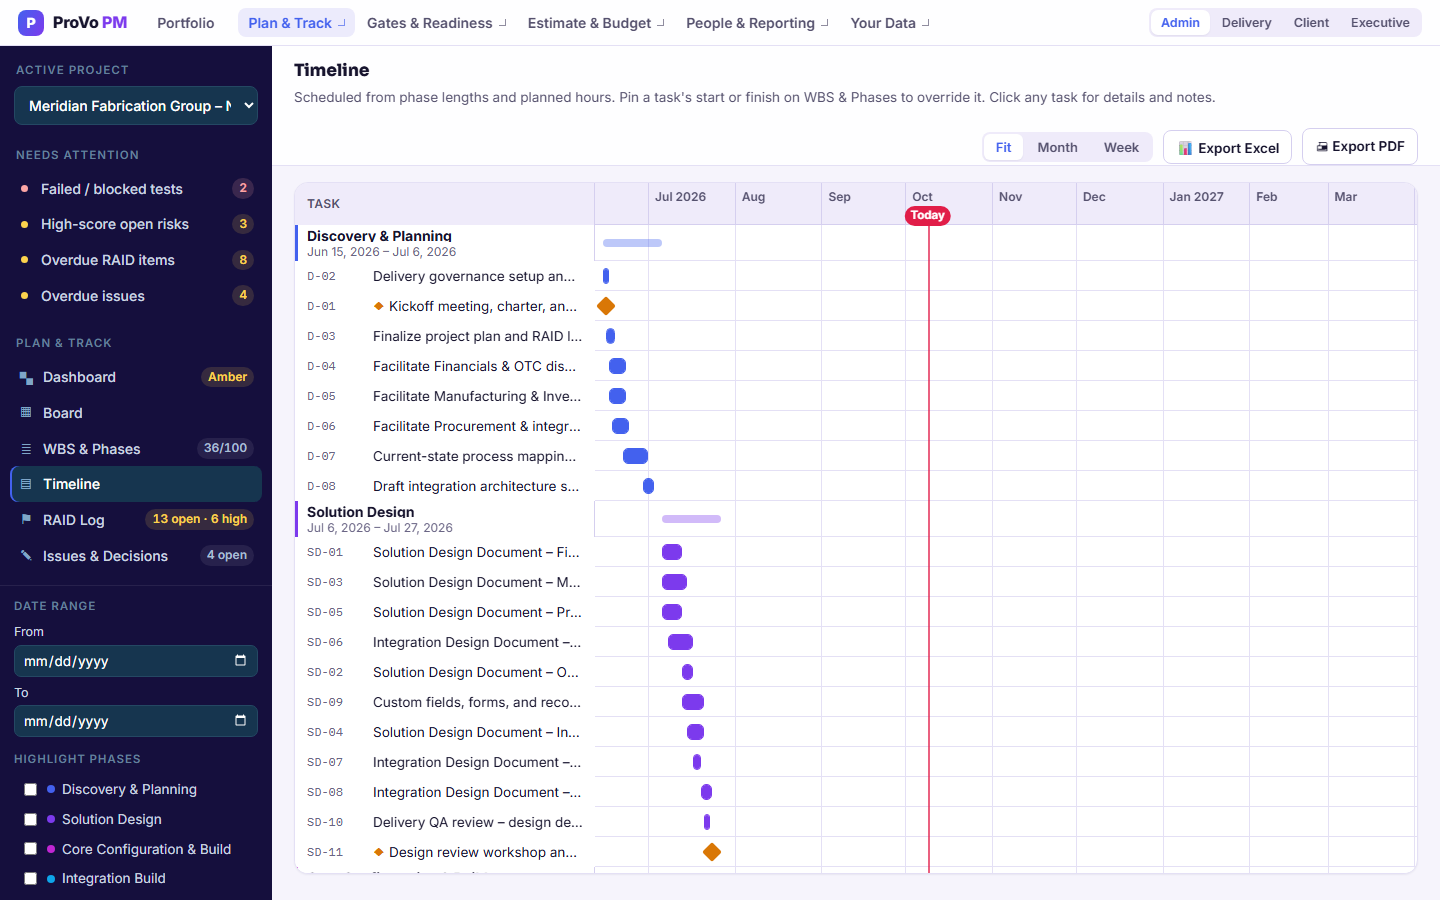
Coloured by Phase
Each phase keeps the colour it has on the WBS and the Board, and each bar fills to the percent complete typed on the task.
Gates as Milestones
A gate is a diamond on its date, not a bar, and it never pushes the next task back.
Zoom and Date Range
Fit the whole plan, or zoom to a month or a week. A Today line shows where you are, and a date range narrows the view.
Export PDF or Excel
Print the chart to PDF, or export the Gantt as an Excel grid to send to a client.
RAID Log
One Log, Four Kinds of Thing That Bite
Risks, assumptions, issues and dependencies in a single register, because they convert into one another constantly and splitting them across four tabs loses the thread. Headline counts show open items, high scores (6 and up), past-due items and items with no owner. Filter by type, score band or status, and the log exports to PDF.
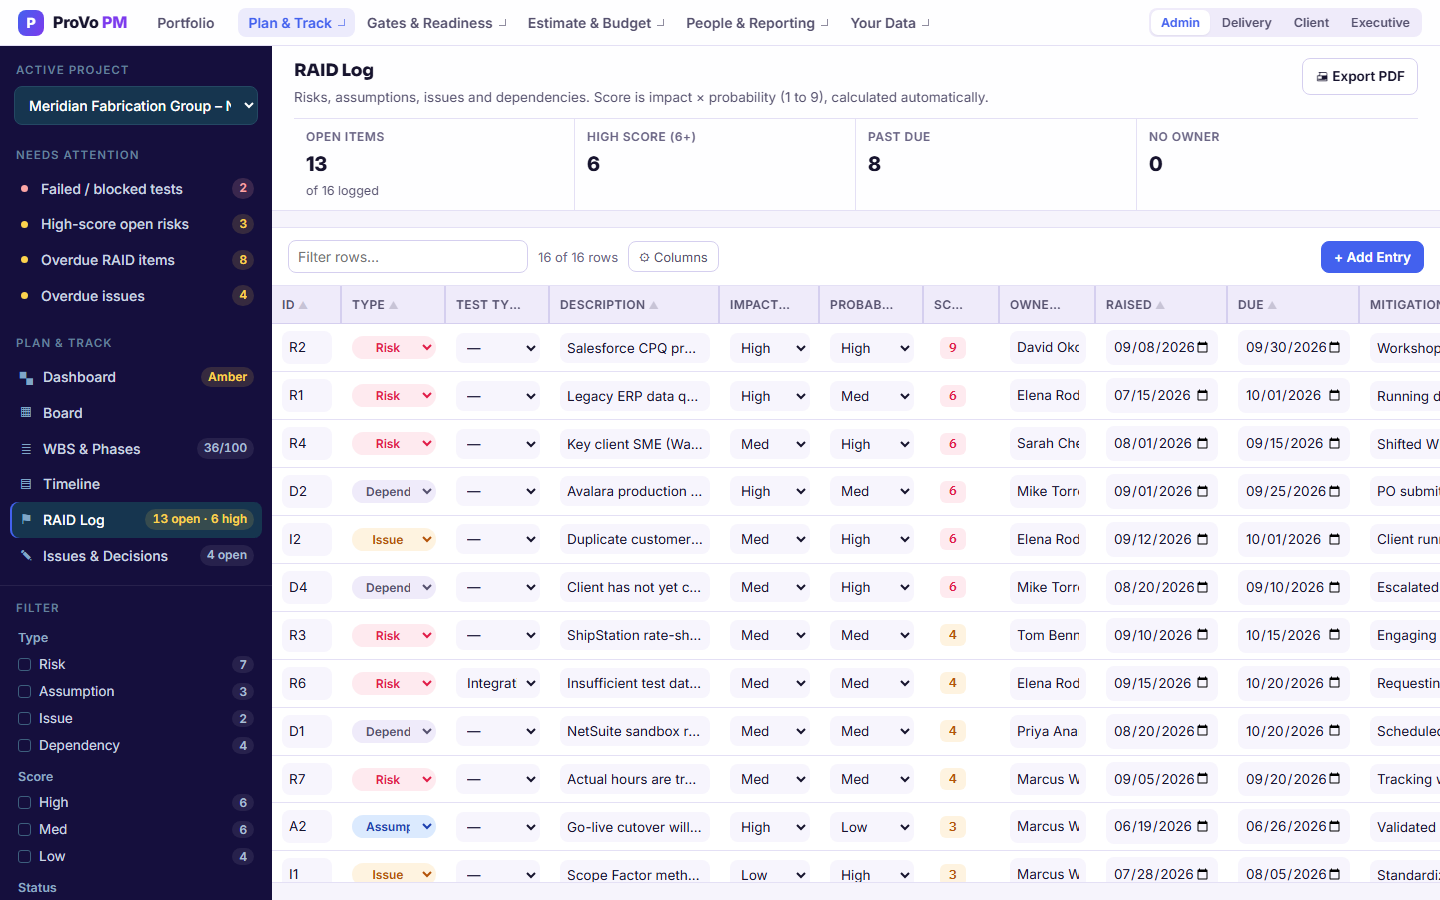
| Field | What Goes in It |
|---|---|
| Type | Risk, Assumption, Issue or Dependency |
| Test Type | Optional. The testing stage an entry came from, from unit testing through UAT to production validation |
| Impact | High, Medium or Low, scored 3, 2, 1 |
| Probability | High, Medium or Low, scored 3, 2, 1 |
| Score | Impact × probability, so 1 through 9. A 9 is high and likely. |
| Owner | A person, not a team. Rows without one are counted under No Owner |
| Raised / Due | Dates, so age is visible |
| Mitigation | What is being done about it |
| Status | Open, Mitigating, Closed or Accepted |
Accepted Is a Real Answer
Most registers only let a risk be open or closed, which pushes teams into closing things that are not resolved. A risk you have looked at, priced and decided to live with is Accepted: still visible, no longer chased.
It Drives the Client Report
An open risk scored high on both axes pushes the weekly report to amber on its own. Three or more open issues on the Issues & Decisions log does the same, and a risk you have marked Accepted stops counting. You can override the colour, but you have to do it deliberately.
Decisions Get Their Own Record
The Issues & Decisions tab is a dated, numbered log kept separately from RAID, because a decision is not a problem and you will want to find it in month nine without filtering past a hundred closed risks. Each entry carries an owner, a priority (P1 to P3, or High, Medium and Low), a due date that is flagged once it passes, and a resolution.
Board & Dashboard
The Same Plan, Drawn as Cards
The Board is the WBS drawn as cards, not a second list. Columns are ranges of percent complete, from Not Started to Complete. Drag a card to another column and its percent complete moves with it, on the WBS, the timeline and the dashboard.
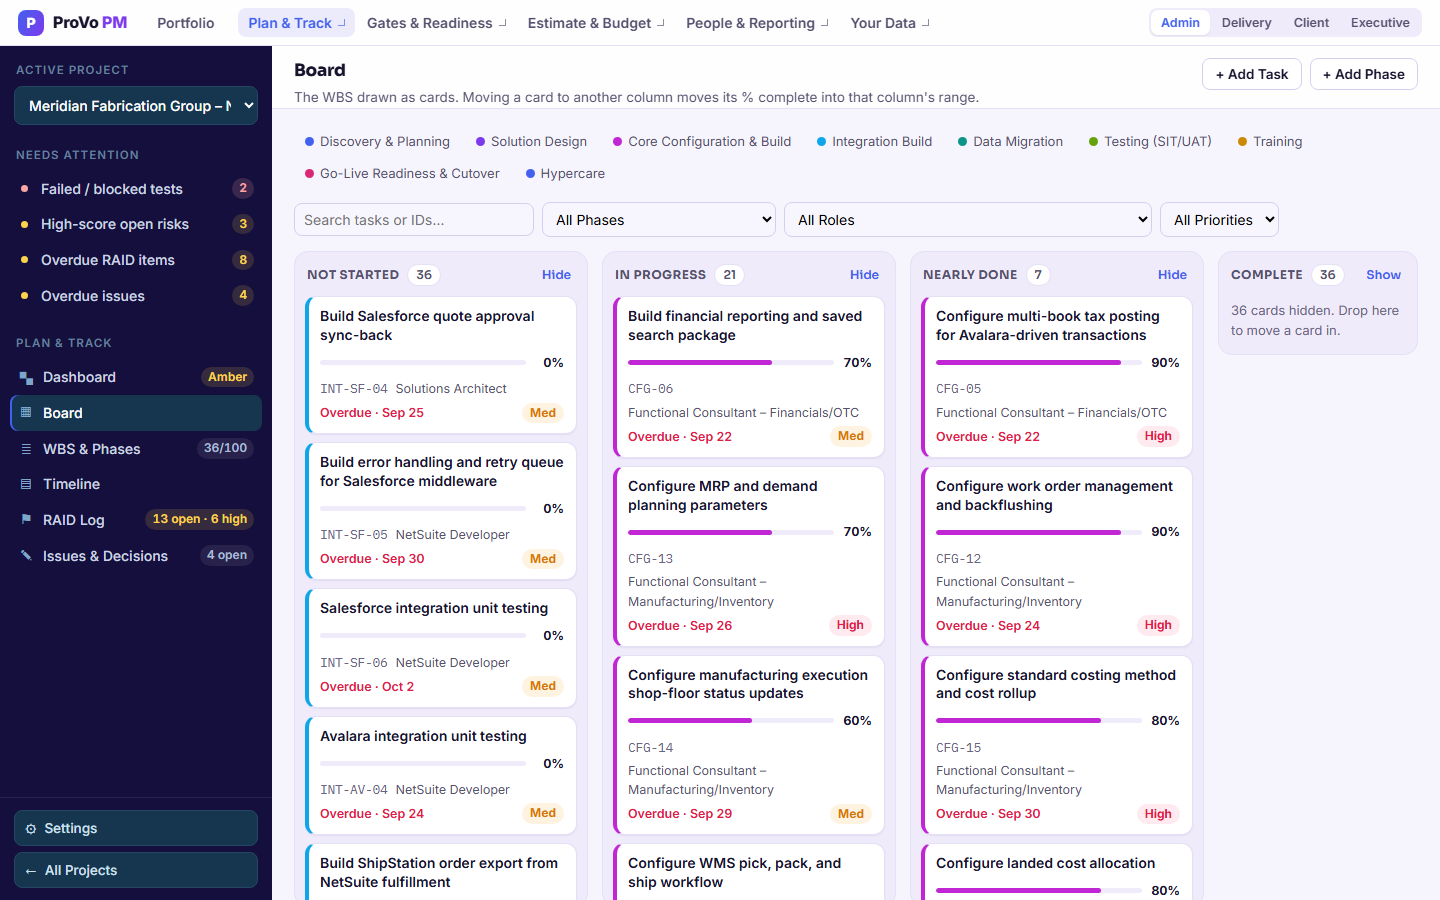
- Cards coloured by phase, with percent complete, role and priority on each
- Add tasks and phases from the board, and edit a task in place
- Filter by phase, role or priority, or search by task name or ID
- Hide a column you are not working in
- Cards past their finish date and not complete are flagged Overdue
Load Your Plan and See It Laid Out
Every tracker takes a CSV. Bring the plan you have now and look at it as a board, a timeline and a budget in the same afternoon.