Home/Product
Product Overview
Every Tracker · One Shared Plan
Every page belongs to the project that is open, and every project lives on the server, so they all read and write the same plan for everyone on it. Open pages refresh about every 10 seconds, and Portfolio shows every project in the workspace side by side.
The Map
Where Everything Lives
Every tab belongs to whichever project is open, grouped by what it's for: planning and tracking, gates and readiness, estimating and budget, people and reporting, and your data.
Every Page, in Menu Order
- Dashboard: weighted percent complete, open gates, open risks, open P1 defects, phase progress, the readiness donut, and your own Custom Query boxes as tables or charts you can drag and resize.
- Board: the same plan as cards in columns by completion, colored by phase. Moving a card updates the WBS.
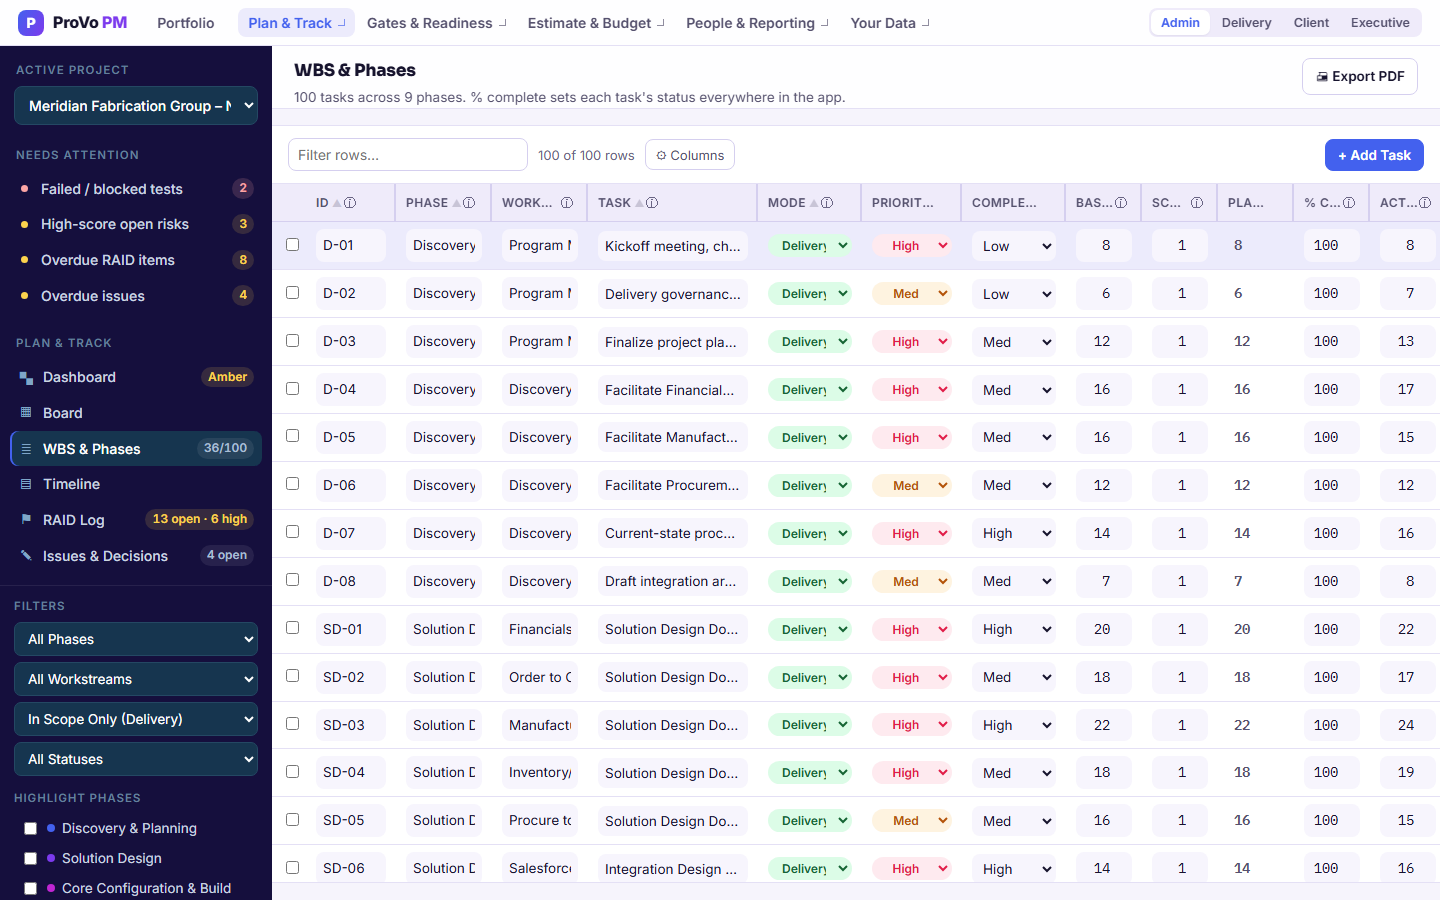
- WBS & Phases: the plan. Baseline hours, scope factor and percent complete drive the numbers; actual hours roll up from timesheets.
- Timeline: the Gantt, laid out from the phase plan and task hours, with gates as milestones and PDF or Excel export.
- RAID Log: risks, assumptions, issues and dependencies, scored 1 to 9.
- Issues & Decisions: the dated, numbered record you will want in month nine.
- Testing Tracker: scenarios from unit test to UAT, pass, fail, blocked or not run, severity, tester, retest, and pass rate.
- Data Migration: object by object, source against loaded, variance and reconciliation.
- Go-Live Readiness: the weighted go/no-go scorecard.
- Estimator: the project's own workstreams become hours, price, margin and duration, then Update Plan & Budget writes the result back.
- Budget: cost by phase, workstream and person, actuals from logged hours, and a live forecast at completion.
- Capacity: demand against the people you actually have.
- Timesheets: logged hours, submitted and approved by week; actuals feed the WBS and budget automatically.
- RACI: one accountable person per workstream, checked.
- Handover: ongoing responsibilities and who takes them.
- Status Report: the client-facing document, built from everything above.
- Custom Queries: filtered, formula-driven views of any tracker, chartable on the dashboard.
- Import / Export: CSV in and out for every tracker, with a preview before anything is saved.
- Roles & Access: each page set to Hidden, View or Edit per role, who sees Financials, and a preview of the plan as any role, including a JSON copy of what that role can see.
- Admin: switch pages on or off for the workspace, apply an industry preset, and rename any page, tracker or field.
- Settings: mode, client, phase and schedule assumptions.
Engagement Mode
Advisory or Delivery, from One Plan
The same engagement costs different amounts depending on whether you are building it or watching someone else build it. Rather than maintaining two task lists, each task carries a mode and the project's mode decides which tasks count.
- Delivery: you are doing the implementation. Delivery and Both tasks count.
- Advisory: the client builds, you direct and assure. Advisory and Both tasks count, and the Estimator scales module hours by 0.7.
- Tasks tagged Both always count. The rest count only in their own mode.
Changing the mode on the Settings page changes which tasks count toward planned hours, what the budget plans for and what the resource demand looks like, in one move. The Estimator starts from the same mode.
What the Toggle Moves
| Number | Advisory | Delivery |
|---|---|---|
| Tasks in scope | Advisory + Both | Delivery + Both |
| Estimator module hours | ×0.7 | ×1.0 |
| Planned hours | Recalculated | Recalculated |
| Budget & margin | Recalculated | Recalculated |
| Resource demand | Recalculated | Recalculated |
Notes
A Note That Survives the Re-Upload
Every row on the main trackers takes a note thread: plan, board, timeline, RAID, issues, testing, migration, readiness, capacity and handover. The thing that makes them useful is where they are anchored.
Keyed to the Item
A note attaches to a business key such as wbs::1.4, not to a row position. Sort the grid, delete rows above it, re-import the whole file from CSV, and the note is still on task 1.4.
Stamped
A date and a name on every entry, so the reason a date moved in March is still readable in September.
Travel with the Project
Notes come along in the JSON copy of the project from Roles & Access, limited to the trackers that role can see. They do not ride in a per-tracker CSV, which keeps client-facing exports clean of internal commentary.
How It Works
Built for More Than One Editor
Every project runs in the cloud, with several people able to work the same plan at once and open pages refreshing about every 10 seconds. The part that matters is what happens when two of them touch it at the same time.
A Blank Cell Never Erases
Clearing a field only ever means "leave this alone", never "delete this." An import, an export, or a second editor's half-finished row can never silently wipe out a value someone already entered.
- Rows are addressed by business key, not position, so a re-sorted or re-imported file still lands on the right row
- Two editors, different fields of the same row: both writes win
- Two editors, the same field: last write wins, the other editor is told, and the overwritten value stays in the server's change log
- A delete racing an edit surfaces as a conflict, never a silent loss
Every Seat Sees the Same Plan
Solo ships with one seat; Practice and Firm add more people working the same plan concurrently, each seeing changes picked up within about 10 seconds.
- Every tracker exports as CSV, with a matching blank template
- A JSON copy of the project, filtered to any role, from Roles & Access
- Role-based access, checked on the server for every read and write, controls who sees which pages and who sees Financials
- Filters live in the link, so a filtered view can be shared as a URL
See It Against Your Own Engagement
Bring a live project. We will load your phases, your tasks and your migration objects and you can decide from there.